A Full-Featured Lead
Conversion Engine
The Altos system uses real-time market reports to attract and engage prospective buyers and sellers. Designed to work with minimal setup, Altos helps you move leads through the funnel automatically, alerting you when they're ready to take action.
Market Reports
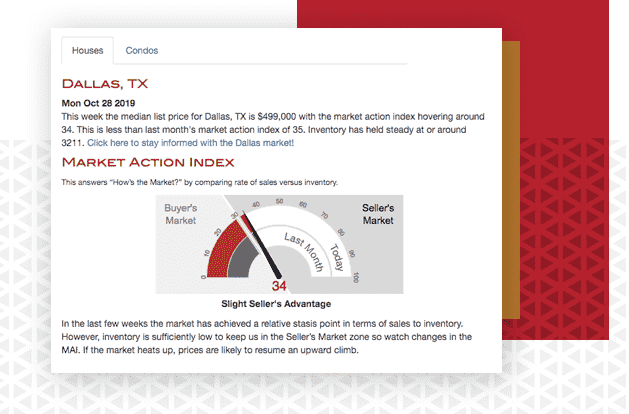
We track over 100M listings every week to deliver real-time market insights in beautifully designed, interactive, mobile-optimized market reports. Our reports are custom branded for your business and include a quick snapshot of the market, an at-a-glance view of market indicators, and market trends charts with a historical view of home prices and other local stats.
Easy to Get Started
Set up your reports
Select a market or zip code for your first report, then add your company’s name, logo, and other branding to personalize your reports in seconds.
Customize your campaigns
Email marketing is a breeze with Altos. Your account comes with four pre-built email campaigns you can edit and customize, or you can create your own campaigns from scratch.
Add your existing contacts
Add contacts manually and assign them to email campaigns, or upload a CSV file to bulk add contacts. Your database is ready to go!
Promote your reports
Click on one of your reports and hit the Share button to post it on social or email it directly to a prospect. Clicking the Promote button allows you set up a paid boost on Facebook in less than a minute.
Get notified when contacts engage
We’ll email or text you the minute someone opens your report email, clicks on your report link, or shares your report. Give them a call and get the conversation going.
100% mobile responsive
Our mobile-first design means that your reports will look great on any device.
Integrates with Your Existing Marketing
Add Altos Reports to your website
Need website content? We’ve got you covered. Add customized web pages, live charts, and stats widgets with just a few clicks.
Integrate with your CRM
You can also manage your Altos campaigns from within your existing CRM system. We’ve got out-of-the-box integrations for Boomtown, Follow Up Boss, Contactually and more.
Beautiful, printed reports
Altos Reports work great offline too. Whether you’re knocking on doors or hosting open houses, printed Altos Reports can help you cultivate your farm.
Dedicated success manager
Our success managers have worked with thousands of Realtors and can help you get the most out of your Altos program.
See Altos in Action.
Check out all of these features first-hand. Schedule a strategy session today.